Looking to Listen at the Cocktail Party:
A Speaker-Independent Audio-Visual Model for Speech Separation
Supplementary Material
Please allow a few seconds for the page to fully load
- Audio-Visual Speech Separation Results (Section 5, "Real-World Speech Separation")
- Comparison with Audio-Only Speech Separation
- Automatic Video Transcription Results (Section 5, "Application to Video Transcription")
- Comparison with Audio-Visual Methods (Section 5, "Comparison with Previous Work in Audio-Visual Speech Separation and Enhancement")
- Visualization of the Visual Contribution Per-Frame (Section 5, "Additional Analysis")
- Example video clips from our dataset (Section 3)
Audio-Visual Speech Separation Results
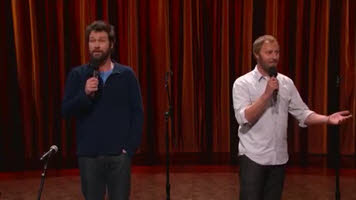
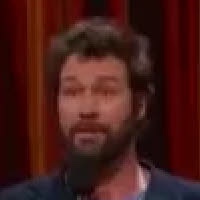
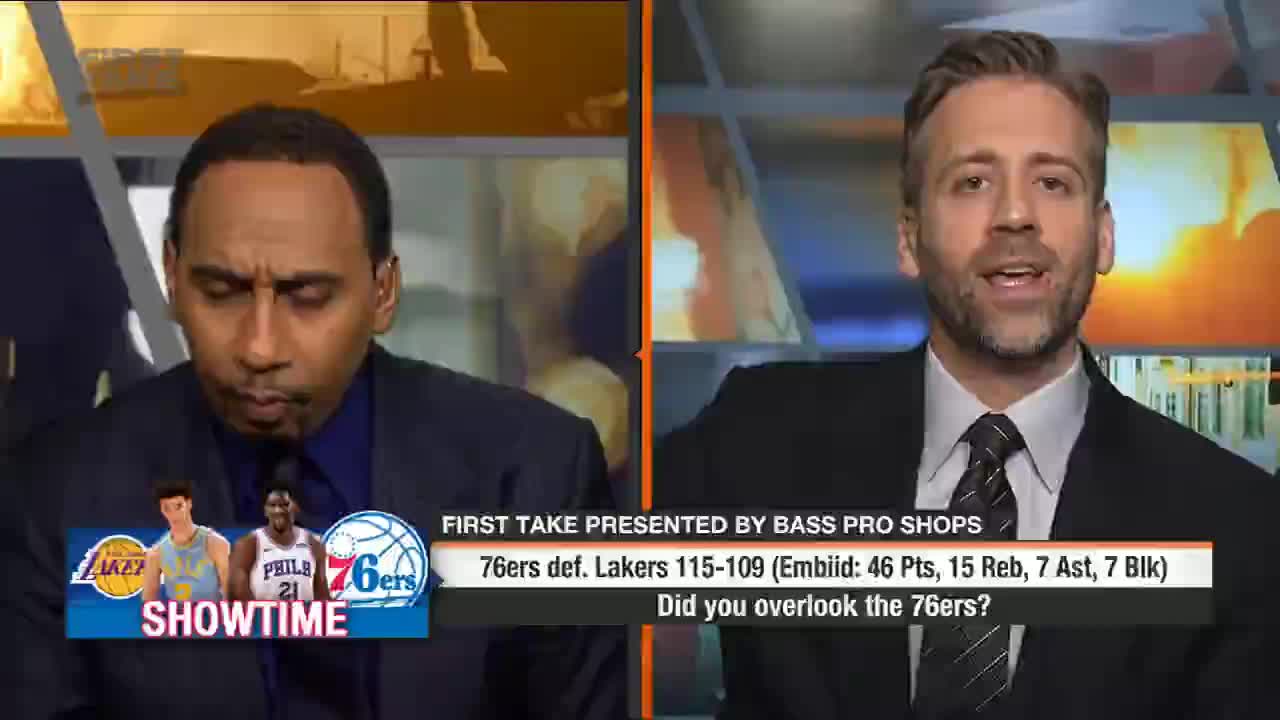
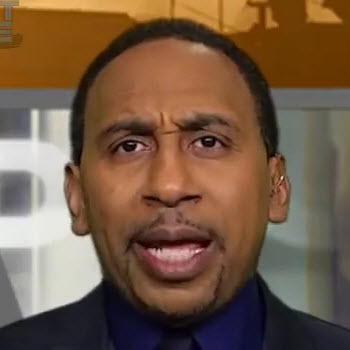
Click on the image thumbnails to see the corresponding source video ("Source") and our speech separation results ("Speaker A", "Speaker B", etc.).
"Stand-Up"
|
||||||||||
Video source: Team Coco |
"Sports Debate"
|
||||||||||
Video source: ESPN |
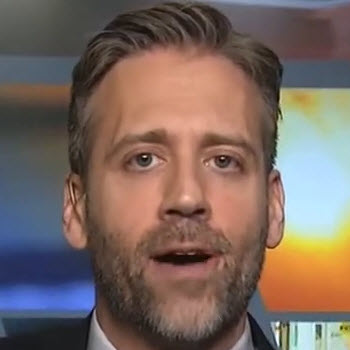
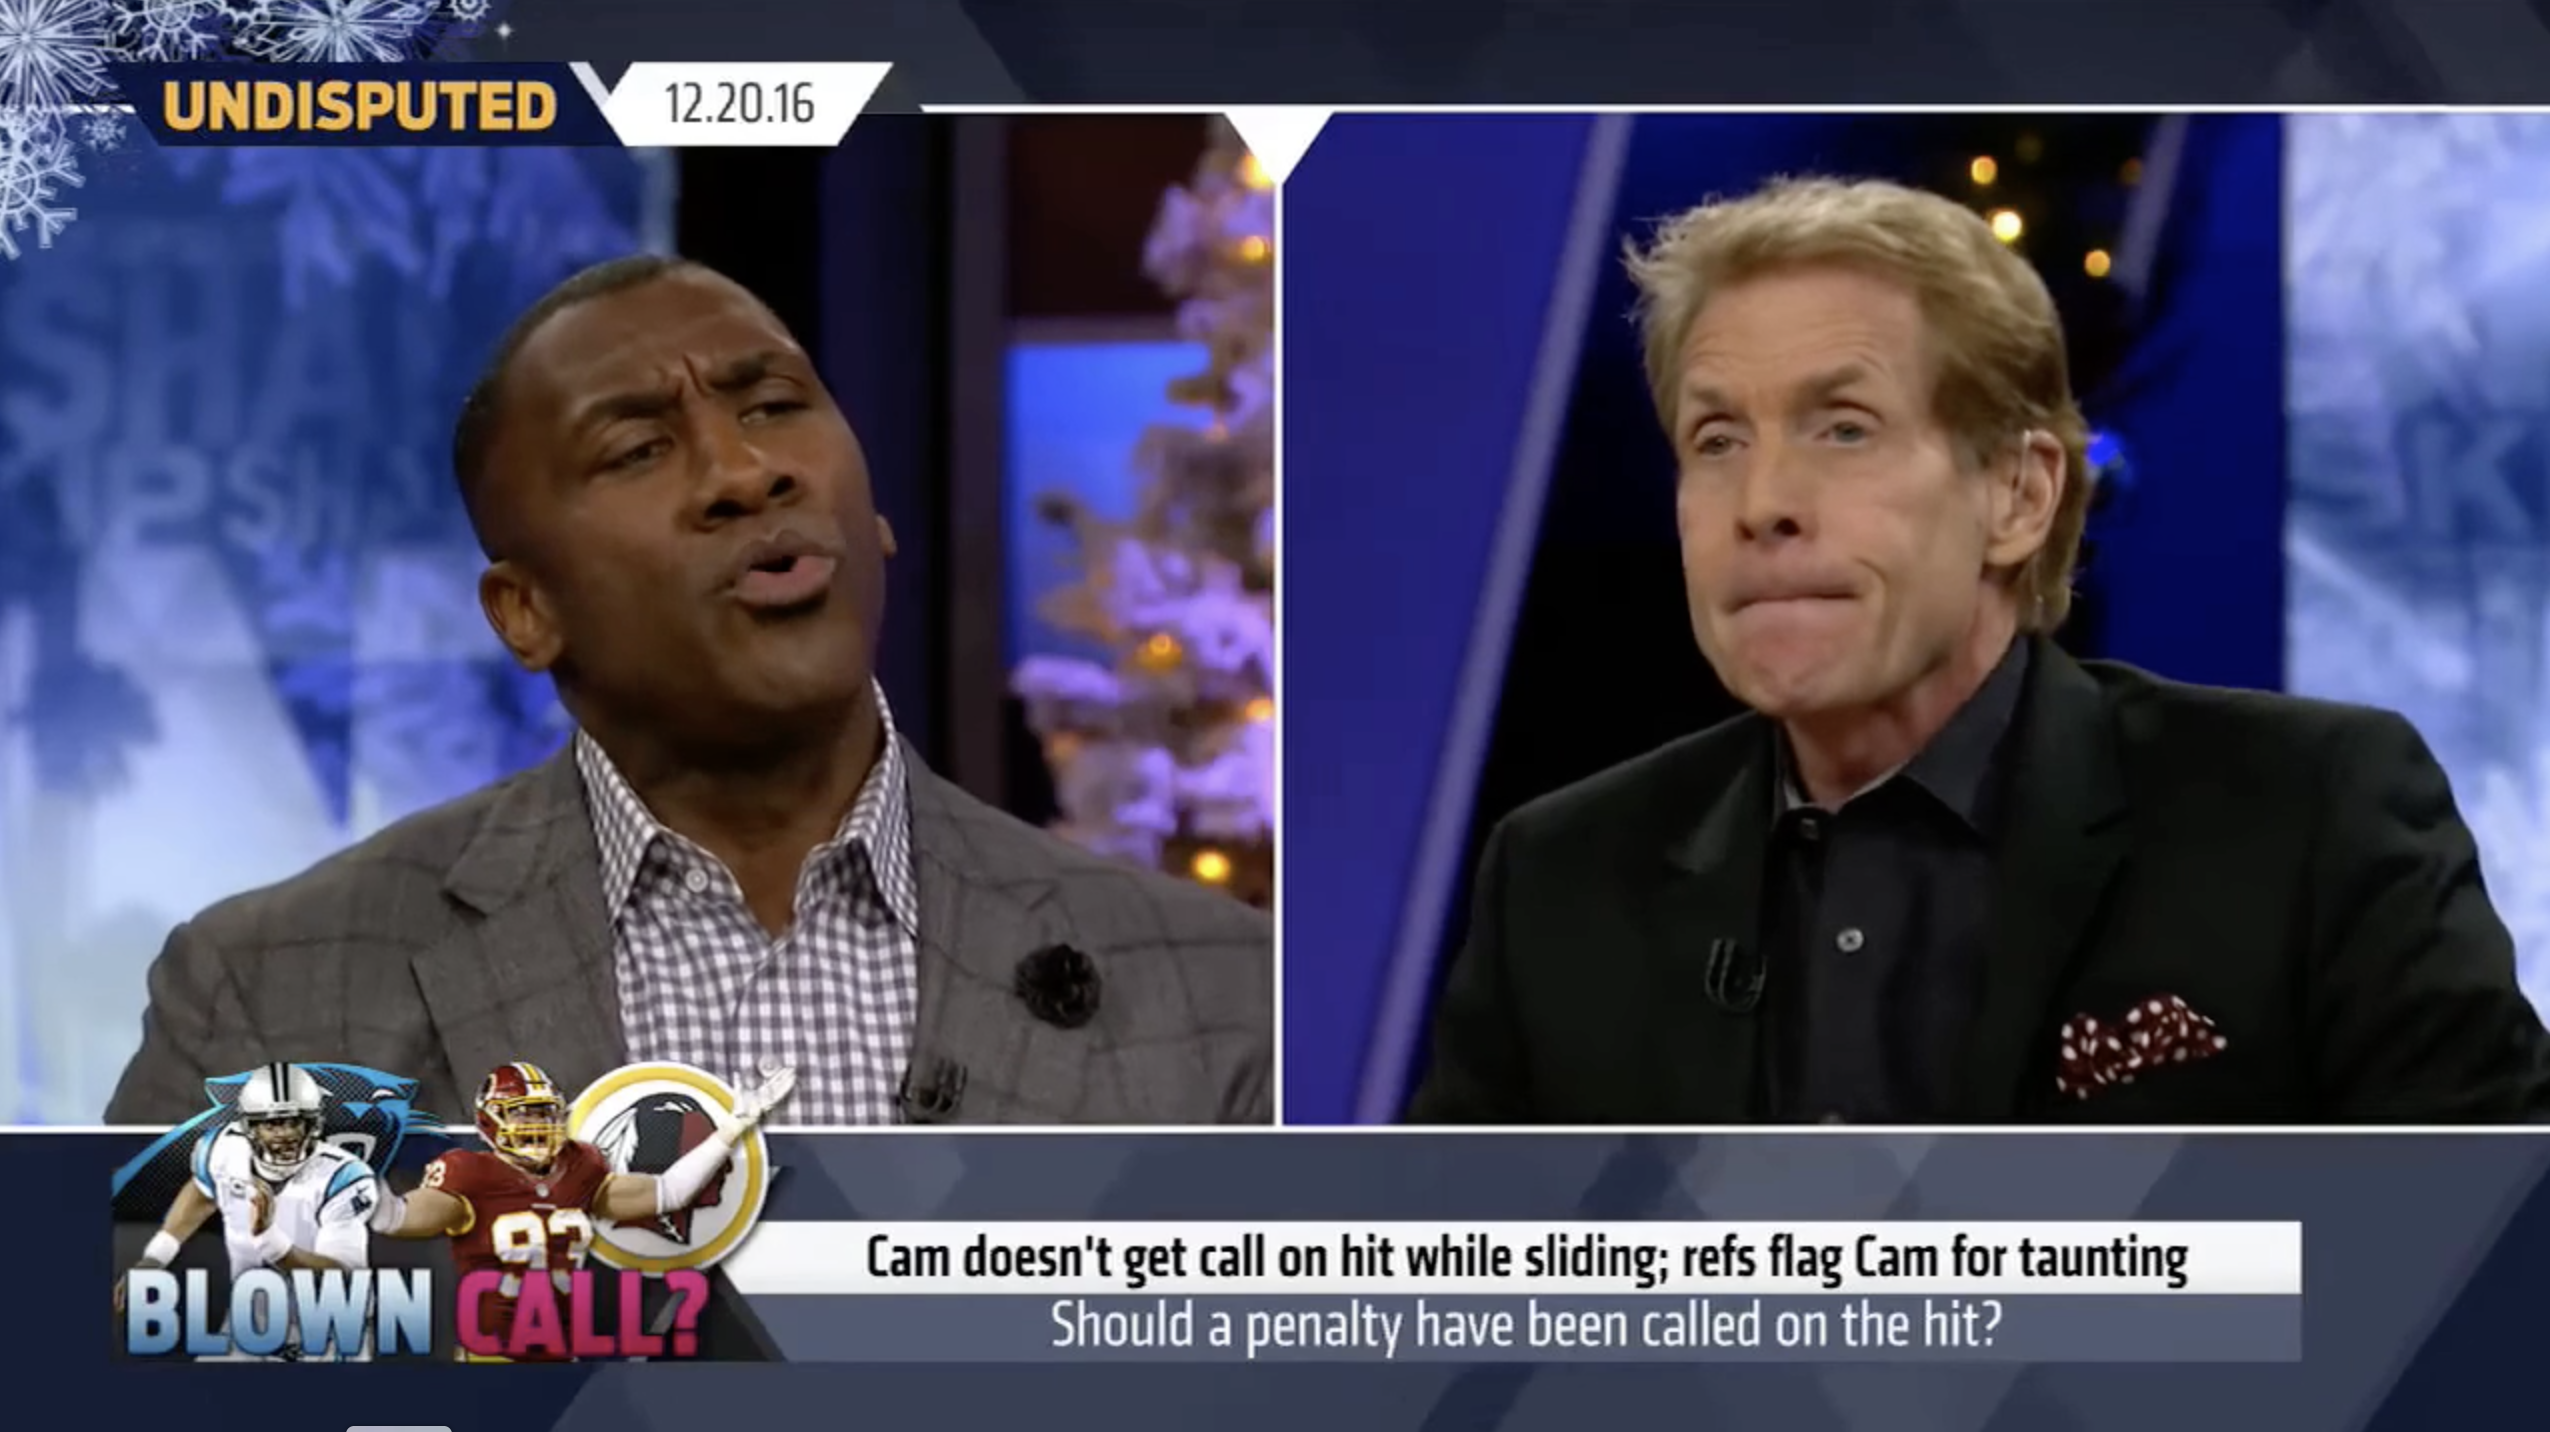
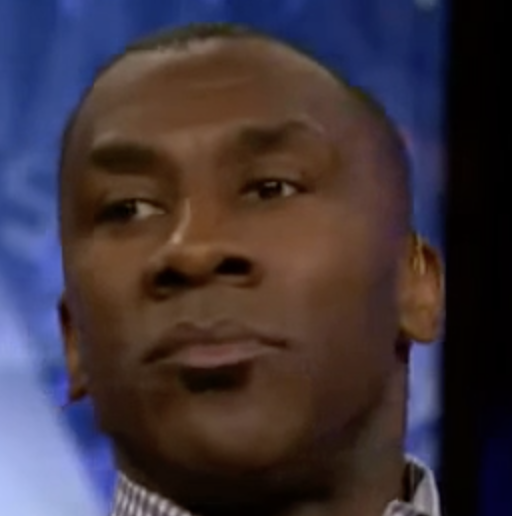
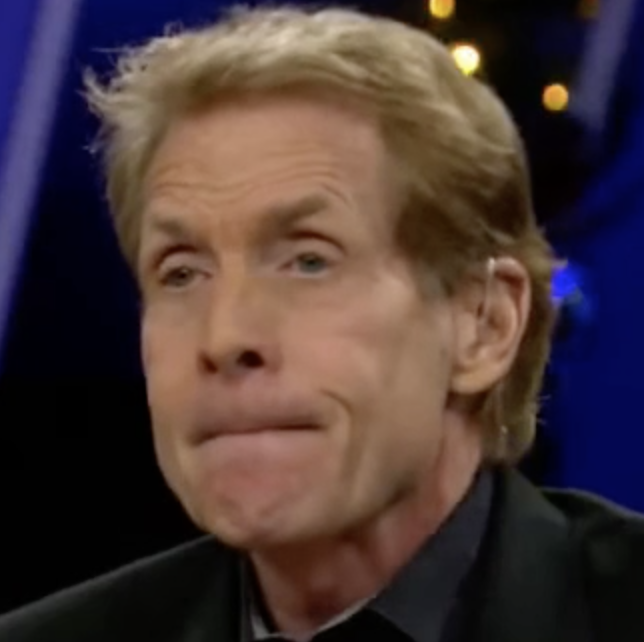
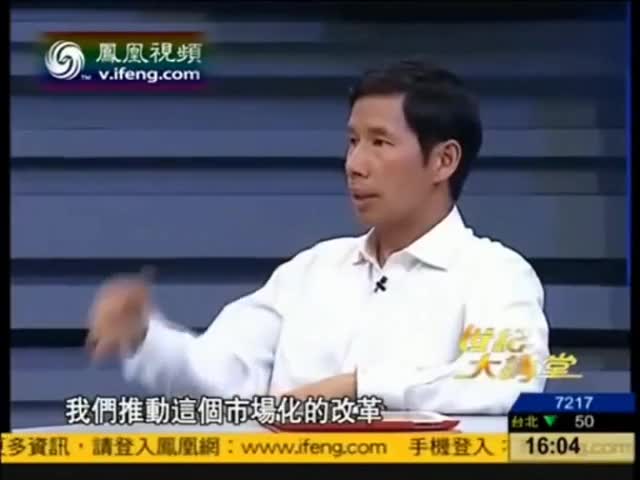
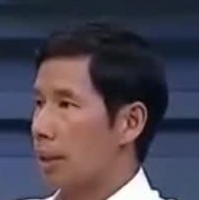
"Undisputed Interview"
|
||||||||||
| Download: [Source] [Speaker A] [Speaker B] |
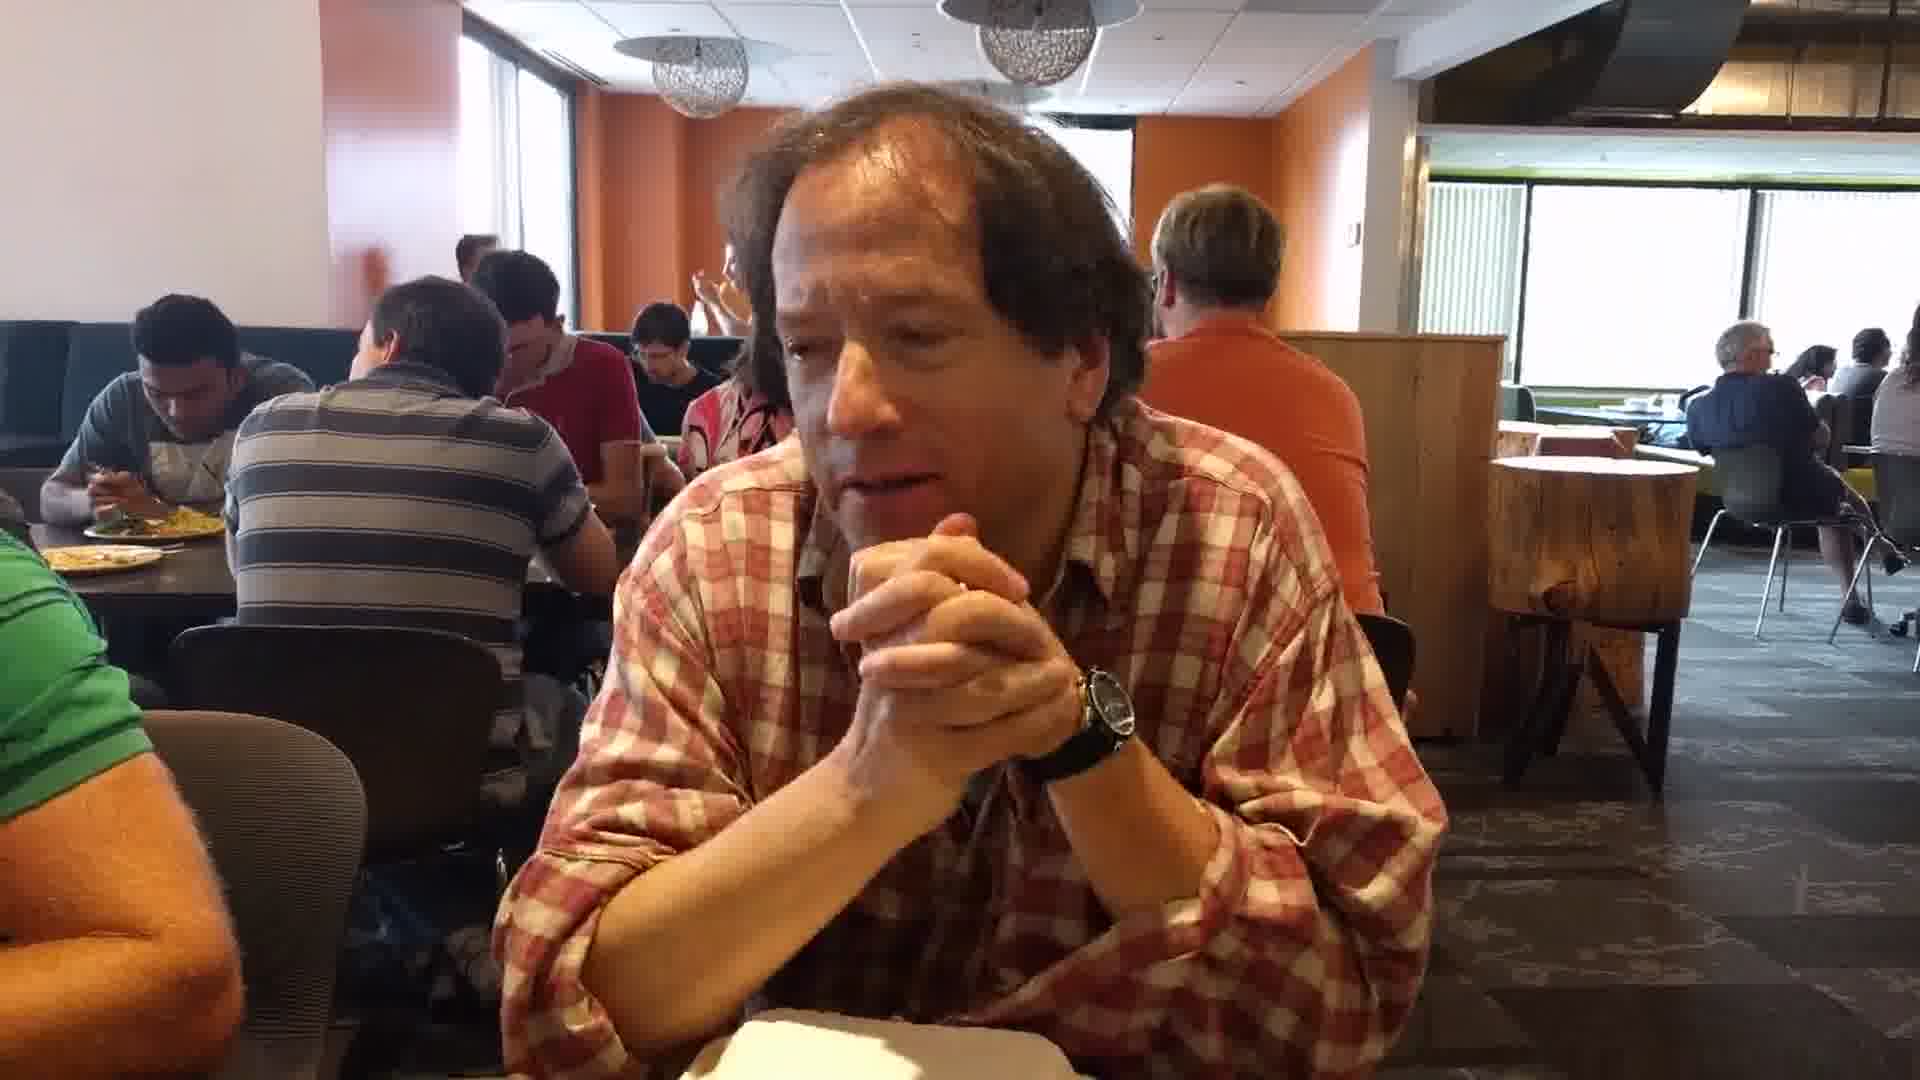
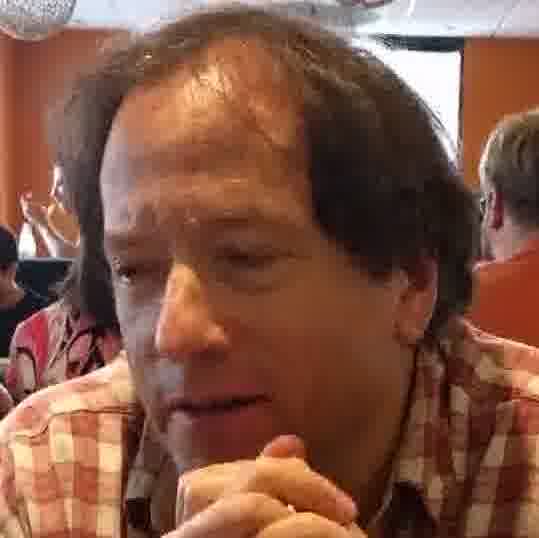
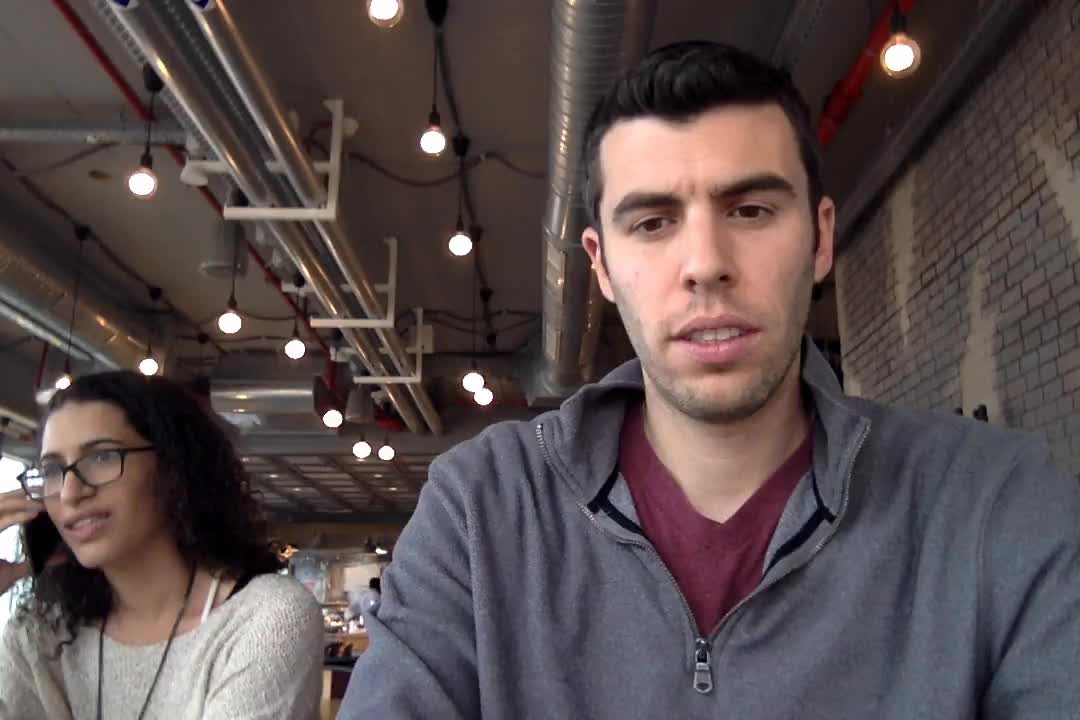
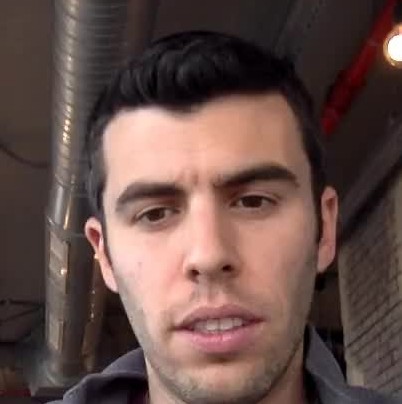
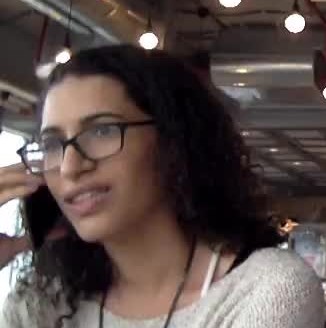
"Cafeteria"
|
||||||
| Download: [Source] [Speaker] |
"Dubbing"
|
||||||||||
| Download: [Source] [Speaker] [Dubbing] |

"Video Conferencing"
|
||||||||||
| Download: [Source] [Speaker A] [Speaker B] |
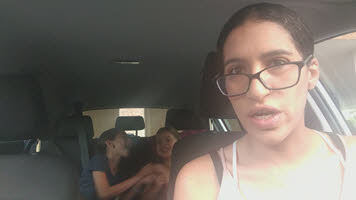
"Car"
|
||||||
| Download: [Source] [Speaker] |
"Noisy Bar"
|
||||||
| Download: [Source] [Speaker] |


Comparison With Audio-Only Speech Seperation
We compare our audio-visual speech seperation results with those of a state-of-the-art audio-only model on a few of the sequences.
** Note that the audio-only model requires manually associating each separated audio track with a speaker in the video.
"Stand-Up" |
||
 |
||
| Audio-only | Audio-visual (ours) | |
| Notice: flipping back and forth between the speakers in audio-only, and how the audience laughter is better suppressed in our audio-visual result. | ||
Automatic Video Transcription Results
Click on the image thumbnails to see the corresponding YouTube auto-generated captions for the source video (with mixed speech) and for our speech separation results.
"Stand-Up" Transcription
|
||||||||||
Comparison with Audio-Visual Methods
We compare our audio-visual speech seperation model with recent audio-visual speech separation and enhancement methods.
Comparison with [Hou et al. 2017, "Audio-Visual Speech Enhancement based on Multimodal Deep Convolutional Neural Network"]
Video #1 |
||||
| Source | Only the speaker, result by [Hou et al. 2017] | Only the speaker, our result | ||
Video #2 |
||||
| Source | Only the speaker, result by [Hou et al. 2017] | Only the speaker, our result | ||
Comparison with [Gabbay et al. 2017, "Visual Speech Enhancement using Noise-Invariant Training"]
Video #1 |
||||
| Source | Only the speaker, result by [Gabbay et al. 2017] | Only the speaker, our result | ||
Video #2 |
||||
| Source | Only the speaker, result by [Gabbay et al. 2017] | Only the speaker, our result | ||
Visualization of the Visual Contribution Per-Frame
To gain insights on how our model utilizes the visual signal, we generated heat maps per-frame that visualize the contribution of different regions in the input frames of several videos on our speech separation result, from blue (low contribution) to red (high contribution).
"TCD-TIMIT" |
"Standup" |
Notice: As expected, the facial regions that contribute the most are located around the mouth, yet other areas such as the eyes and cheeks contribute as well.